The Death of the 20% Daily Candle
Remember 2021? Bitcoin could pump 15% on a Tuesday for no reason. A single tweet could trigger a 20% dump. Liquidation cascades were a weekly occurrence. The market was wild—and that's exactly what made it exciting.
Fast forward to 2024. Bitcoin Spot ETFs are approved. BlackRock, Fidelity, and other institutional giants pour billions into the market. And suddenly... the volatility disappears.
Daily moves that used to be 5-8% are now 1-2%. The "God candles" are gone. The market feels... boring.
What happened? Did institutional capital kill the fun? Or are we just witnessing the maturation of an asset class?
The Numbers Don't Lie
Let's look at the data. In 2021, Bitcoin's average daily volatility was 4.8%. Wild swings were the norm. By 2024, after ETF approval, that number dropped to 2.1%—less than half.
At the same time, institutional flow volume increased from negligible levels to representing over 65% of daily trading volume.
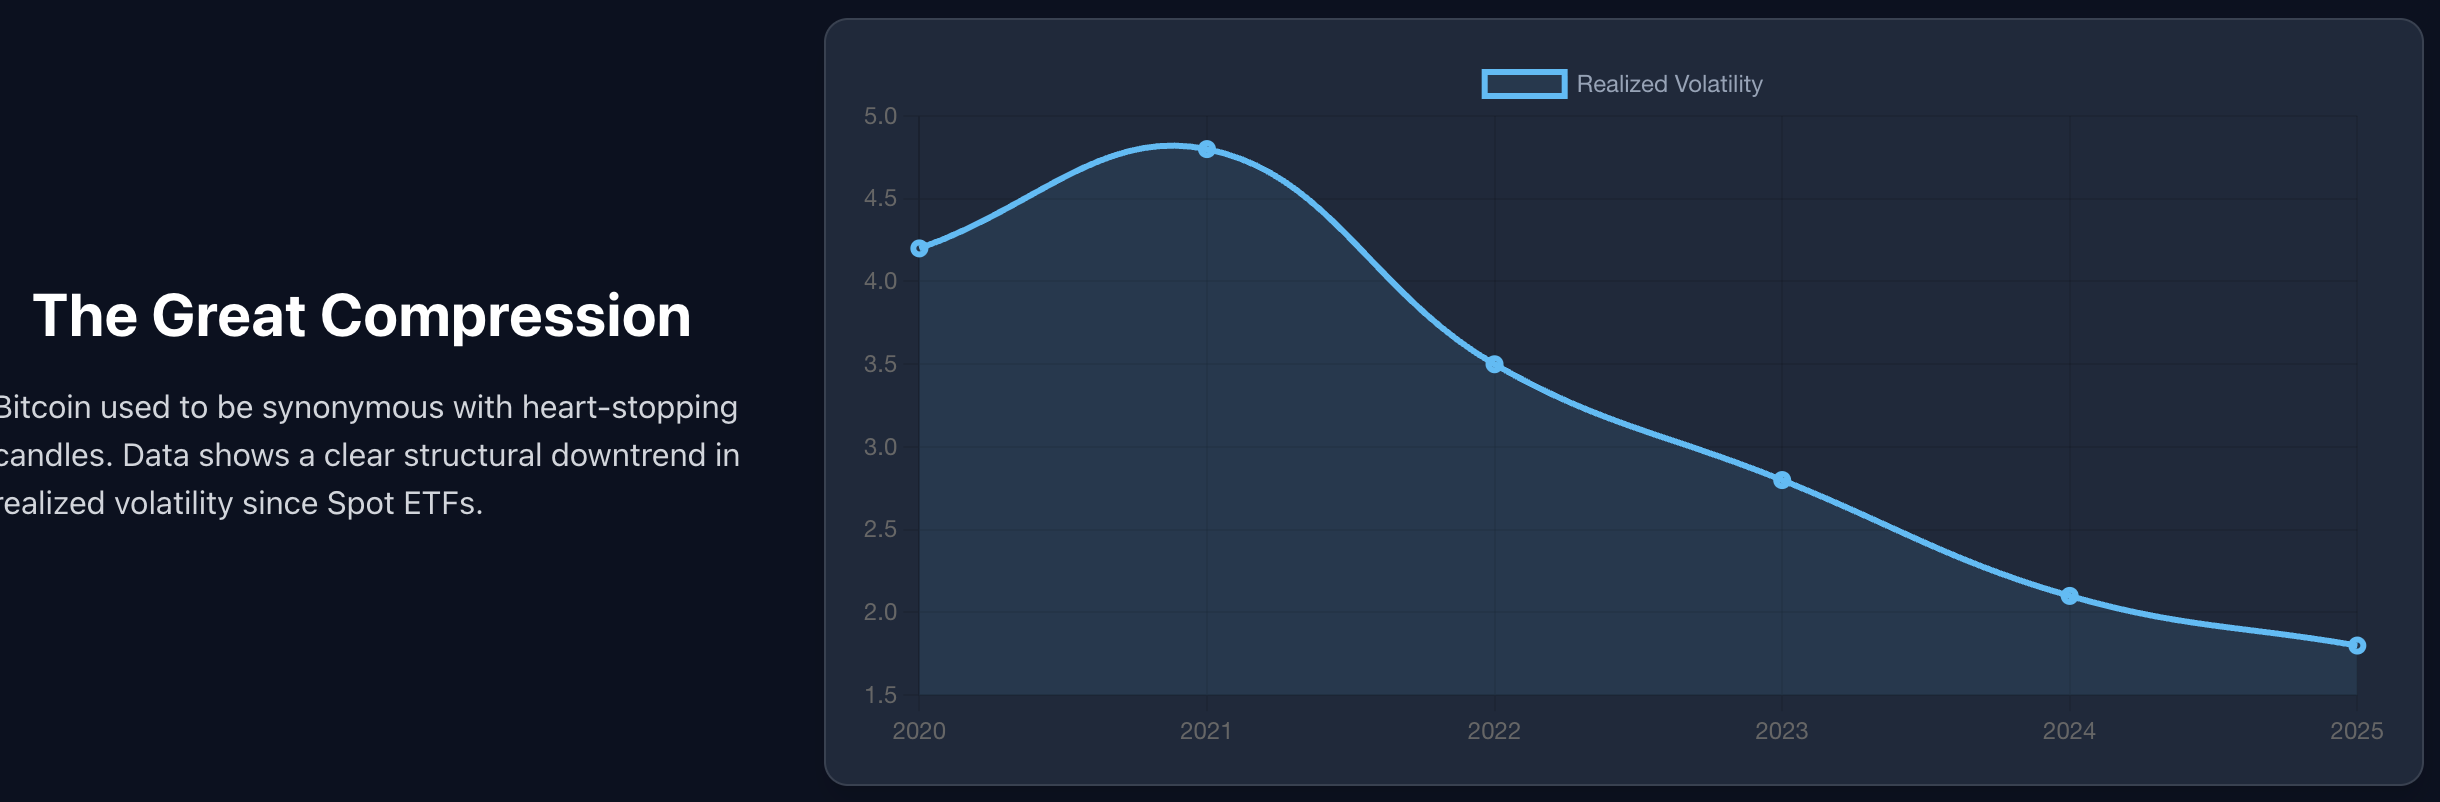
This isn't a coincidence. It's a structural shift in how the market operates.
The Dampener Mechanism
Why do ETFs suppress volatility? It comes down to liquidity mechanics.
In the "retail era," Bitcoin was dominated by emotional traders. When bad news hit, everyone panic-sold at the same time. When good news dropped, everyone FOMO'd in. This created massive price swings.
But institutional money doesn't panic. ETFs operate on systematic rebalancing. When the price drops, they don't sell—they buy to maintain their allocation targets. When the price spikes, they don't chase—they sell to rebalance.
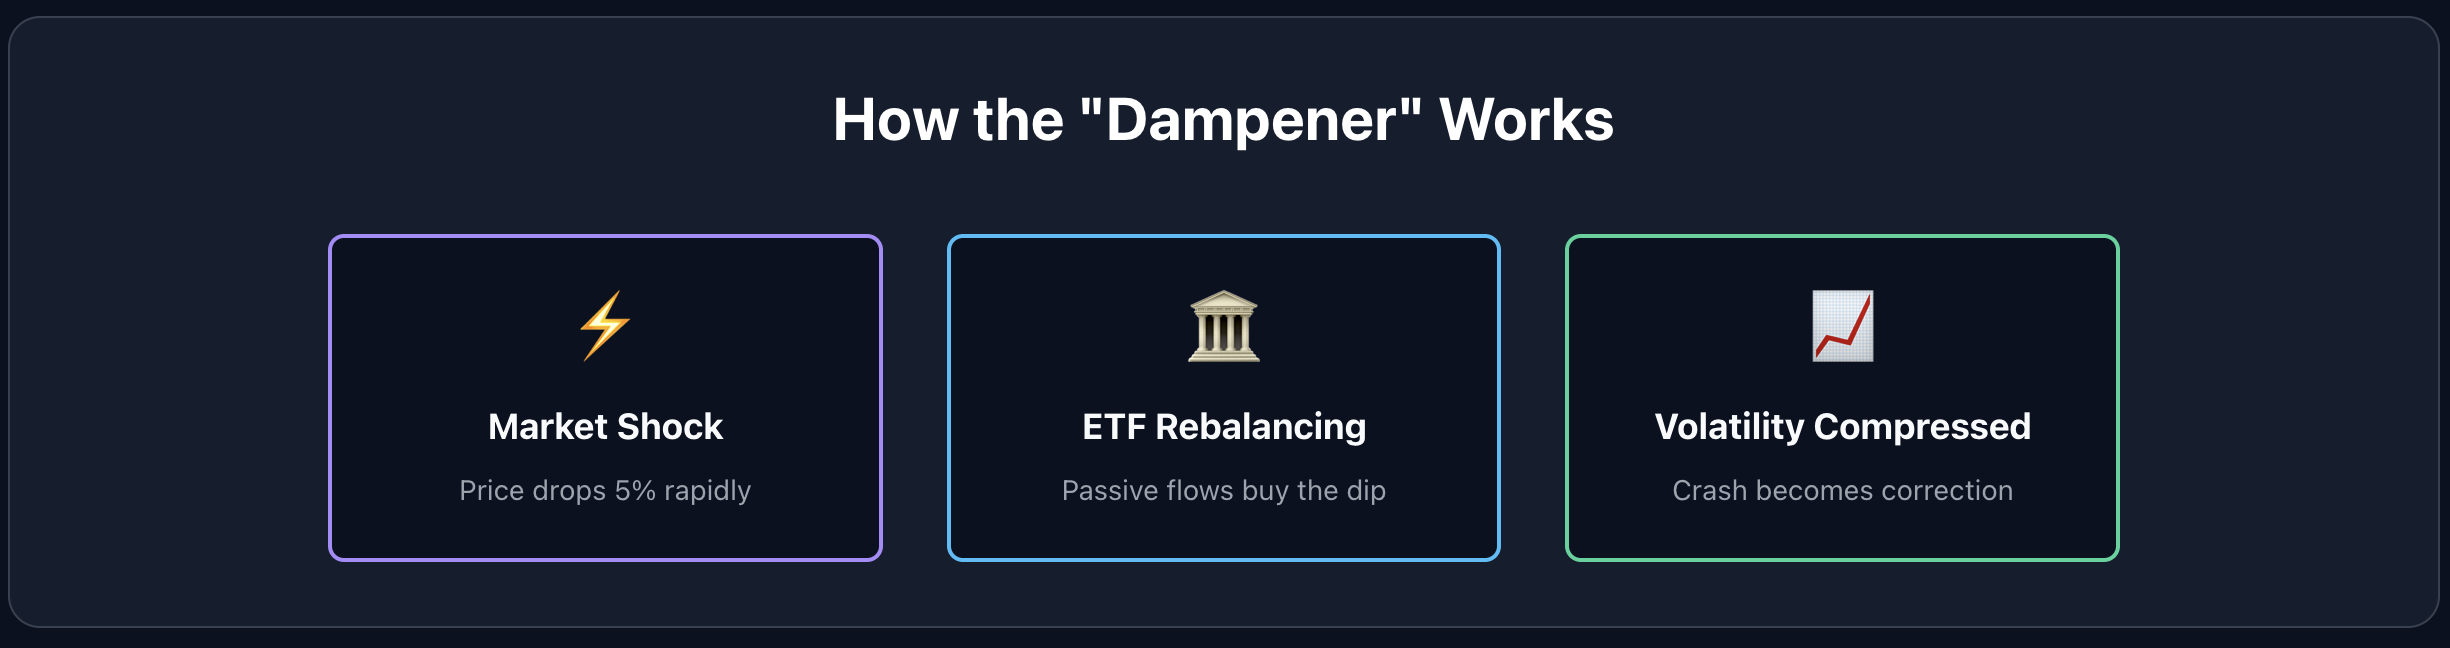
Step 1: Market Shock
Bad news hits. Retail traders panic. Price drops 5% in an hour.
Step 2: ETF Rebalancing
Institutional flows automatically buy the dip. Not because they're bullish—but because their algorithms require it to maintain target allocations.
Step 3: Volatility Compressed
The massive liquidity absorbs the sell pressure. What would have been a 20% crash in 2021 becomes a 5% "correction" in 2024.
The Volatility Surface: A Structural View
To truly understand this shift, we need to look at the Volatility Surface—a 3D visualization that plots Implied Volatility (IV) against Strike Price and Time to Expiration.
In the retail era, this surface was jagged and steep. Deep out-of-the-money options had massive implied volatility because traders expected extreme moves. The market was pricing in chaos.
Today, the surface is smoother and flatter. The "smile" (the curve showing higher IV at extreme strikes) has compressed. Why? Because institutions are selling volatility to harvest yield.
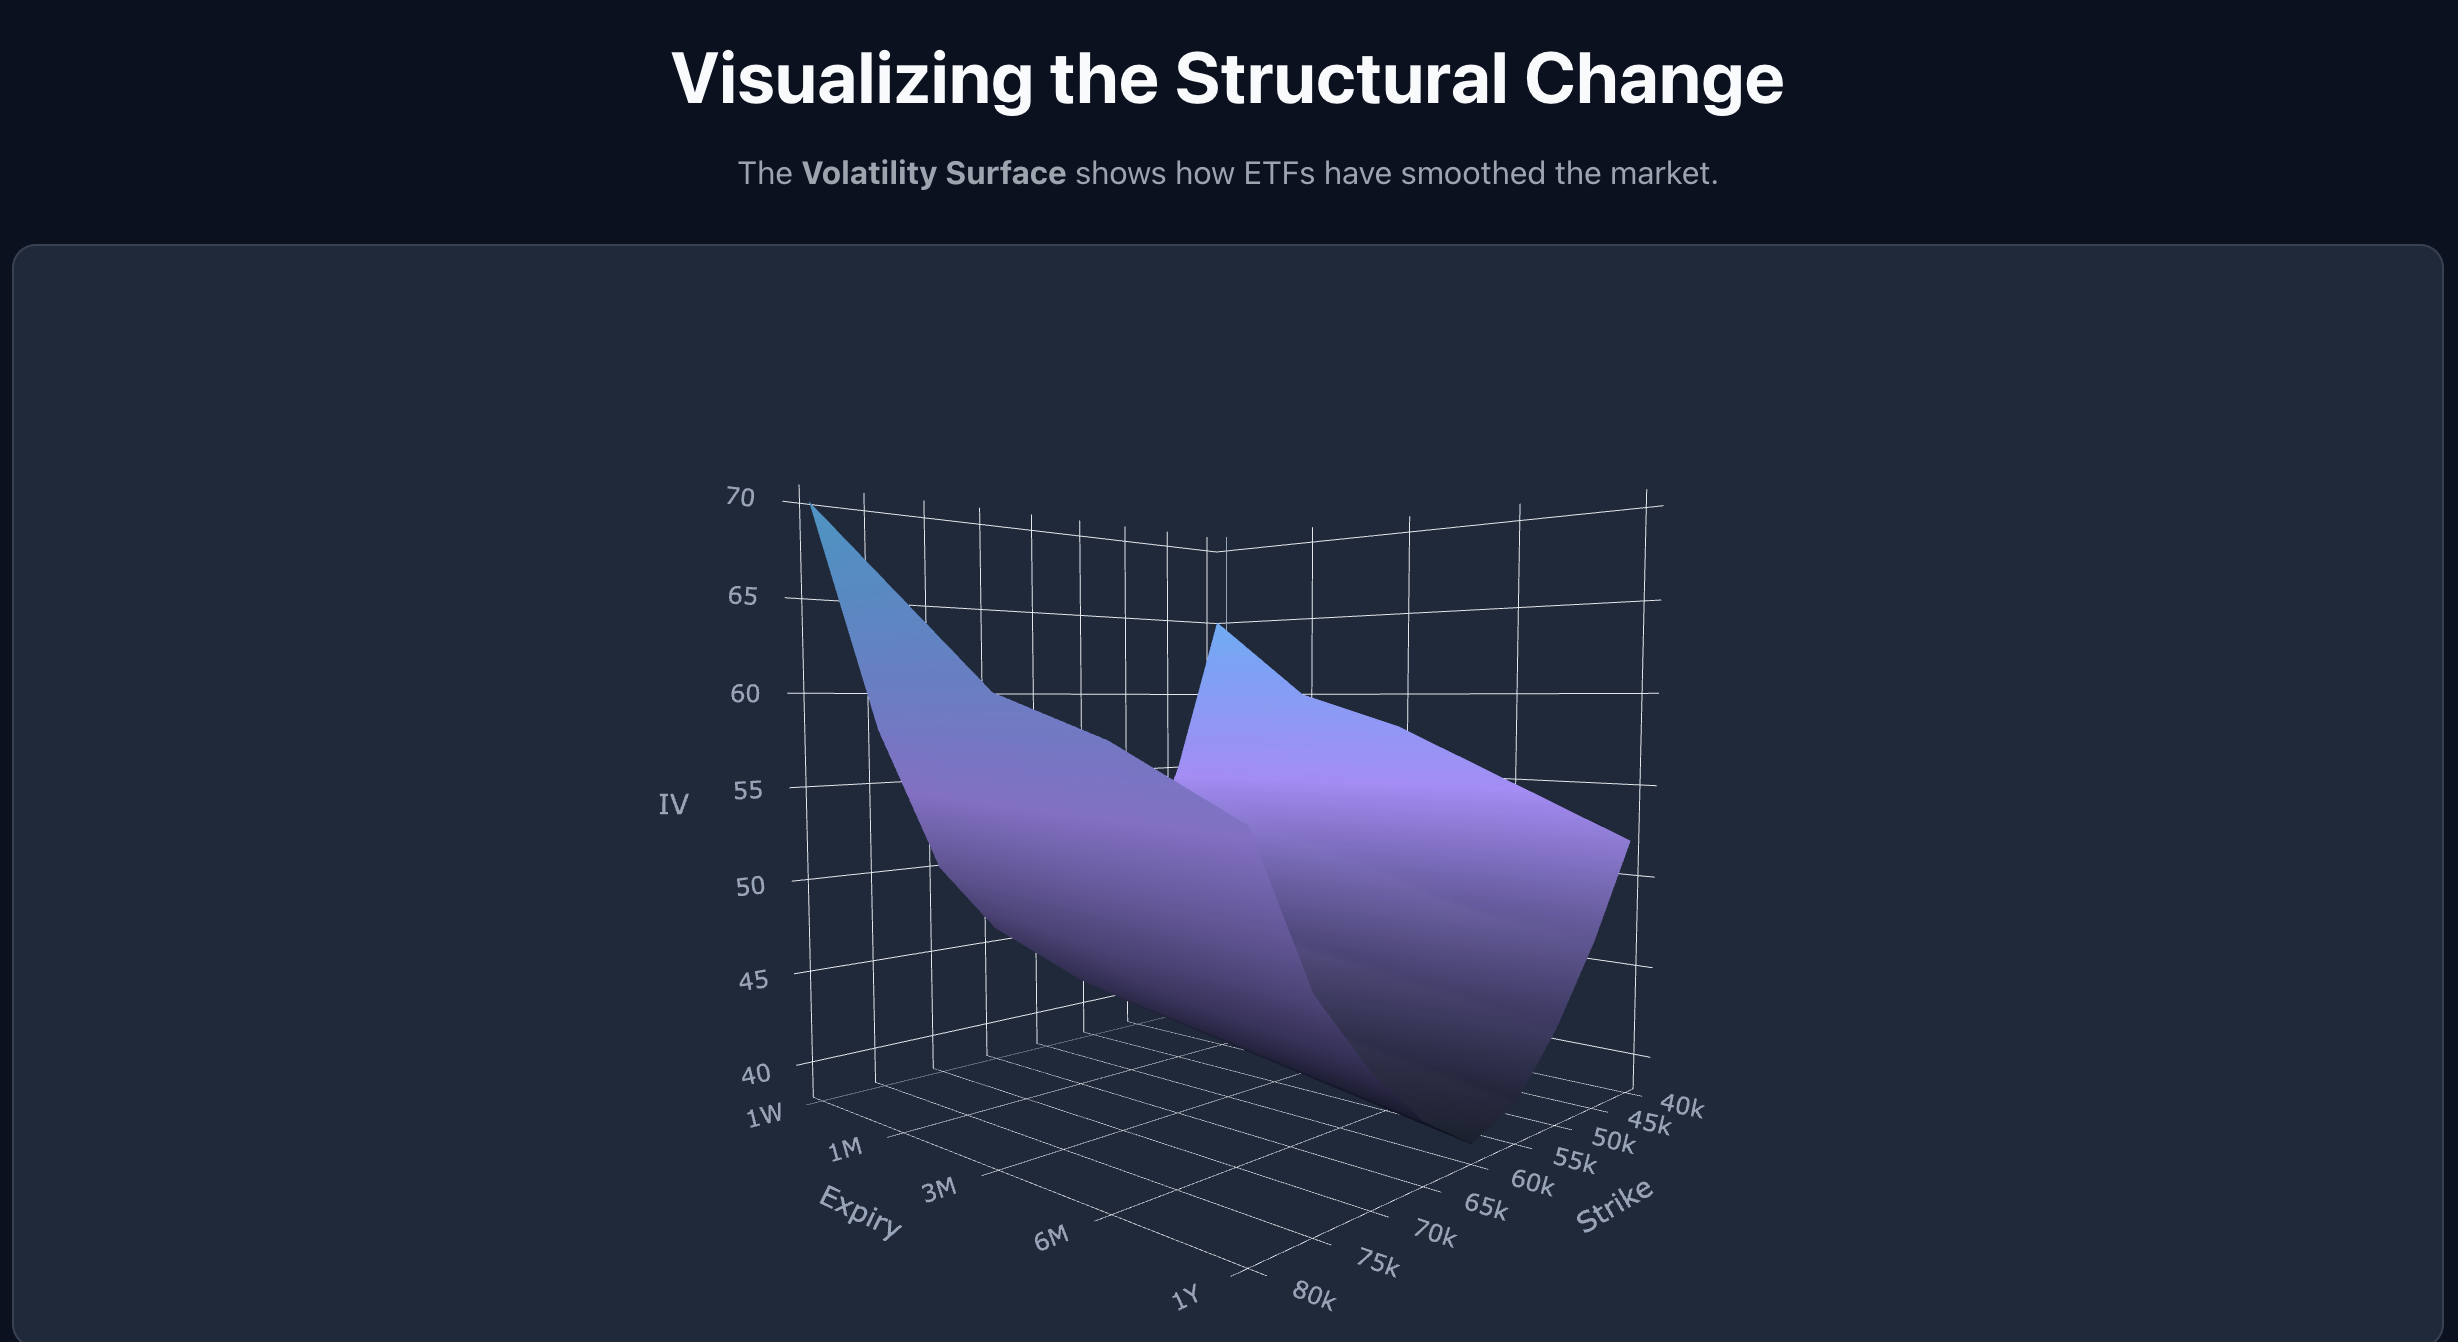
When you see a flatter volatility surface, you're seeing the fingerprint of institutional capital. They're systematically suppressing the extremes.
What This Means for Traders
Is this good or bad? It depends on your strategy.
If you're a long-term holder: This is great news. Lower volatility means less risk. Your portfolio won't get cut in half overnight. Bitcoin is becoming a "real" asset class.
If you're a volatility trader: This is a nightmare. The strategies that worked in 2021—buying straddles and hoping for a 10% move—are now losing money. The market isn't moving enough to justify the premium you're paying.
If you're a swing trader: You need to adapt. The 5-minute chart is dead. You need to zoom out to daily or weekly timeframes to find meaningful moves.
The New Edge: Structural Data
In this new regime, the edge isn't in predicting price. It's in understanding market structure.
Simple price charts won't cut it anymore. You need to know:
- Where is Gamma Exposure (GEX) concentrated? This tells you where market makers are forced to hedge, creating invisible support/resistance levels.
- What does the Volatility Surface look like? Is it steepening (fear returning) or flattening (complacency)?
- Where are institutional dealers positioned? Are they net long or short? This determines the direction of systematic flows.
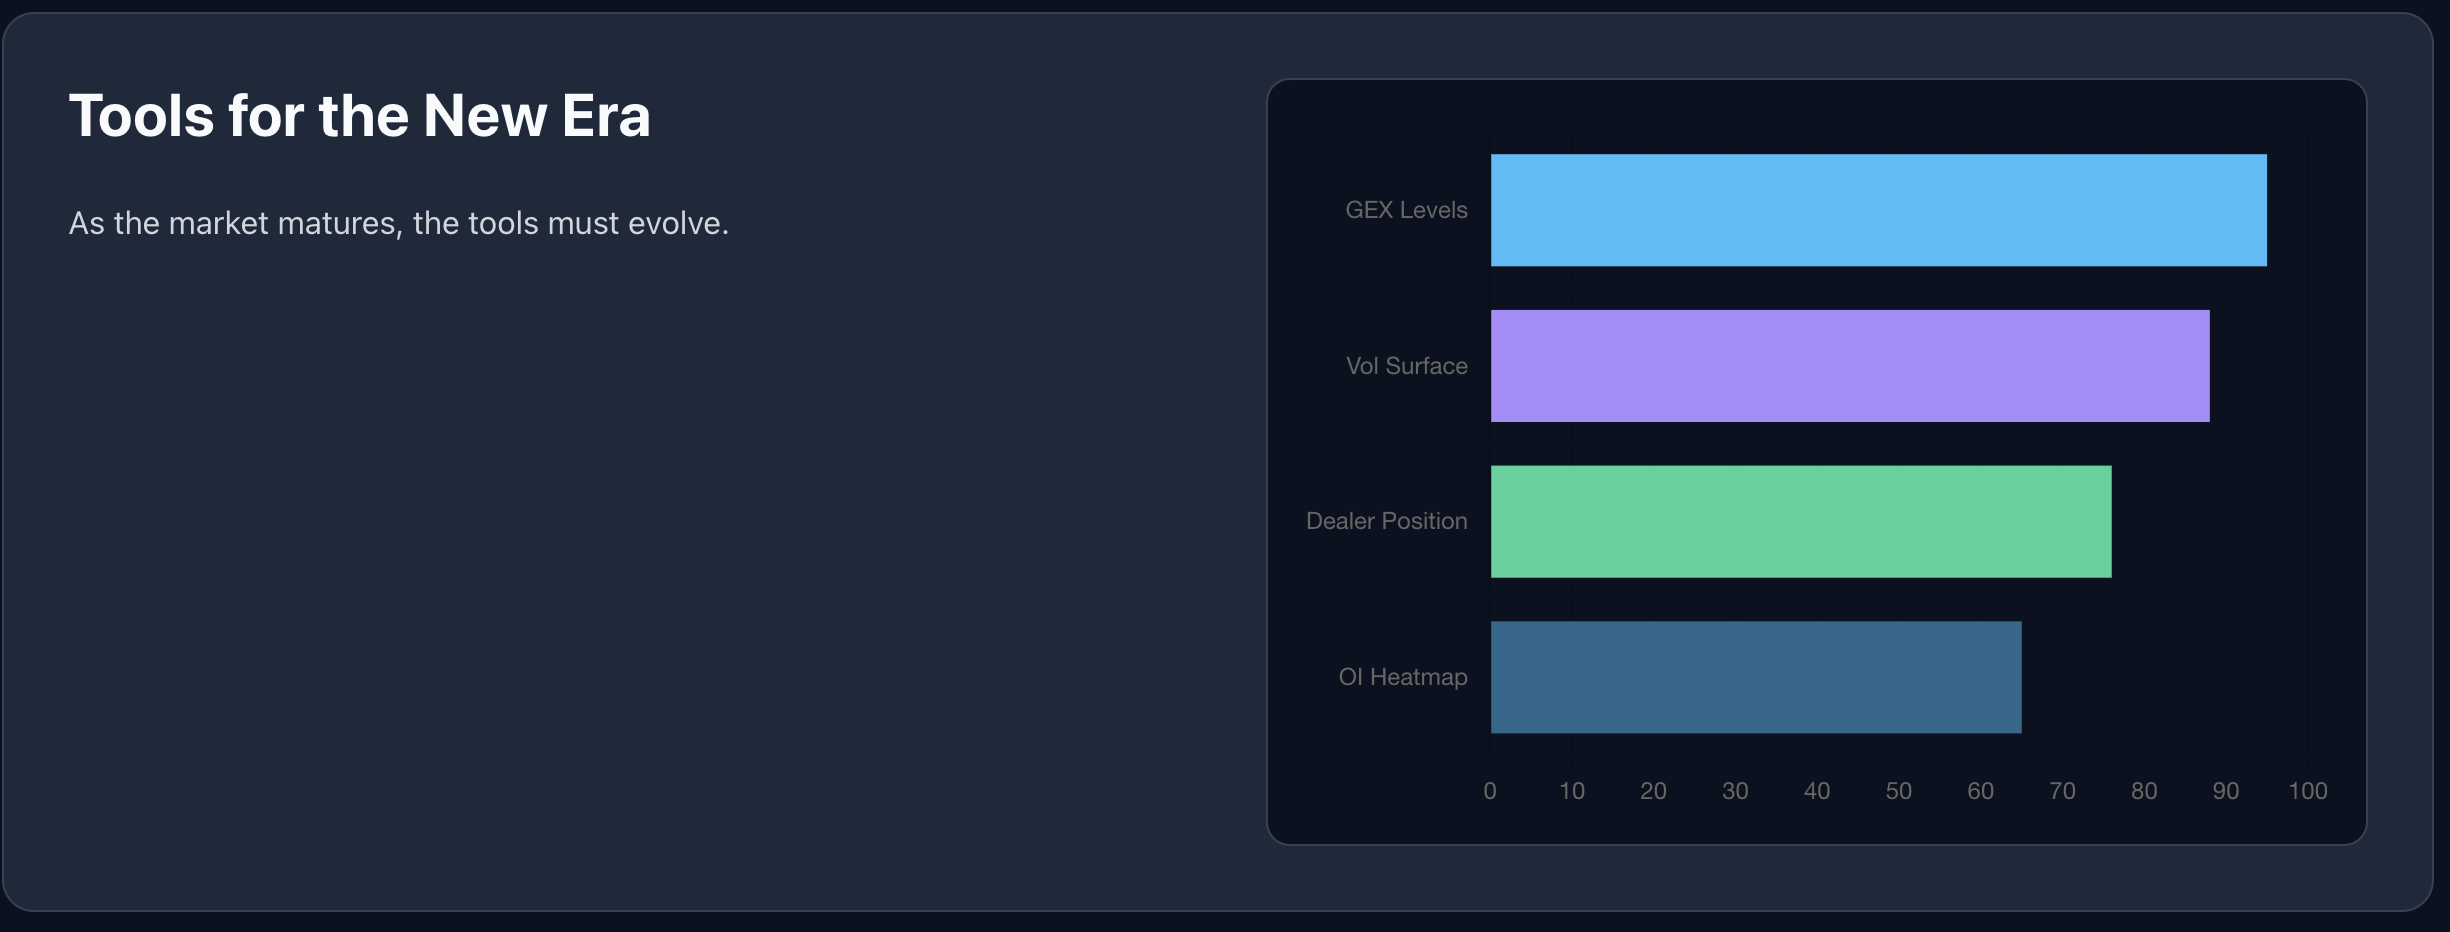
What Blockskew Is Building
The market has evolved. The tools need to evolve with it.
At Blockskew, we're focused on bringing institutional-grade metrics to passionate crypto traders. Here's what's coming:
1. Real-Time Gamma Exposure (GEX) Levels
See exactly where market makers are forced to hedge. These levels act as magnets—price tends to gravitate toward them. This is invisible on a price chart but critical for understanding short-term moves.
2. Live Volatility Surface Visualizer
Track how the volatility smile changes in real-time. When the surface steepens, it's a warning sign. When it flattens, it signals complacency. This is the early warning system for regime changes.
3. Institutional Dealer Positioning Heatmaps
Know where the "smart money" is positioned. Are dealers net long or short? This determines the direction of systematic rebalancing flows—the same flows that are dampening volatility.
4. Options Open Interest Heatmaps
Visualize where the biggest option positions are concentrated. High open interest at a specific strike creates a "pin"—the market tends to settle near these levels at expiry.
The Brutal Truth
The ETF Dampener hasn't killed opportunity. It's just changed the game.
The days of blind 100x leverage on a hunch are over. The market is too efficient for that now. But for traders who understand structure—who know how to read Gamma, Vanna, and dealer positioning—the edge is bigger than ever.
Because while retail traders are still staring at candlesticks, institutional players are trading the infrastructure. They're not asking "will price go up?" They're asking "where is the liquidity?" "What's the volatility regime?" "How are dealers positioned?"
And that's exactly what Blockskew is designed to answer.
The New Normal
Bitcoin's volatility isn't dead. It's just compressed. The 20% daily candles might be gone, but the 5-10% moves are still there—you just need better tools to catch them.
The market has matured. The question is: have you?
If you're still trading like it's 2021, you're going to get left behind. But if you're willing to learn the new language of the market—Gamma, Vanna, Skew, Dealer Positioning—you'll find that the opportunity is still there.
It's just hidden in the structure.
Welcome to the post-ETF era. The wild west is over. But the gold rush? That's just getting started—for those who know where to dig.